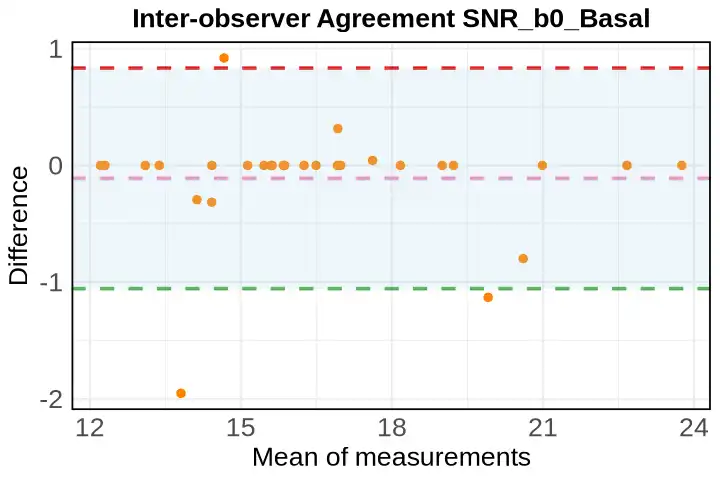
1
2
3
4
5
6
7
8
9
10
11
12
13
14
15
16
17
18
19
20
21
22
23
24
25
26
27
28
29
30
| bland.altman.ggplot2 <- function (group1, group2, var_n, two = 1.96, mode = 1, conf.int = 0, geom_count = FALSE)
{
ba <- BlandAltmanLeh::bland.altman.stats(group1 = group1, group2 = group2,
two = two, mode = mode, conf.int = conf.int)
values <- data.frame(m = ba$means, d = ba$diffs)
geom_my <- if (geom_count)
ggplot2::geom_count
else ggplot2::geom_point
m <- NULL
d <- NULL
p <- ggplot2::ggplot(values, ggplot2::aes(x = m, y = d)) + geom_my() +
geom_point(color = RColorBrewer::brewer.pal(8, 'Set1')[5], size = 2) +
theme_minimal() + labs(title = paste0("Inter-observer Agreement ", var_n)) +
ggplot2::xlab("Mean of measurements") + ggplot2::ylab("Difference") +
theme(
axis.title.x = element_text(size = 16),
axis.title.y = element_text(size = 16),
axis.text.x = element_text(size = 16),
axis.text.y = element_text(size = 16),
panel.border = element_rect(color = "black", fill = NA, linewidth = 1),
plot.title = element_text(size = 16, face = "bold", hjust = 0.5)
) +
ggplot2::geom_hline(yintercept = ba$lines['mean.diffs'], linetype = "dashed", linewidth = 1, color = RColorBrewer::brewer.pal(8, 'Set1')[8]) +
ggplot2::geom_hline(yintercept = ba$lines['lower.limit'], linetype = "dashed", linewidth = 1, color = RColorBrewer::brewer.pal(8, 'Set1')[3]) +
ggplot2::geom_hline(yintercept = ba$lines['upper.limit'], linetype = "dashed", linewidth = 1, color = RColorBrewer::brewer.pal(8, 'Set1')[1]) +
ggplot2::annotate("rect", xmin = -Inf, xmax = Inf, ymin = ba$lines['lower.limit'], ymax = ba$lines['upper.limit'],
alpha = 0.2, fill = "lightblue")
return(p)
}
|

