Last updated on April 25, 2026 pm
配置环境
示例
1
2
3
4
5
6
| require(ggplot2)
require(ggpubr)
require(tidyverse)
require(RColorBrewer)
options(repr.plot.width=6, repr.plot.height=12)
RColorBrewer::display.brewer.all(type = "all")
|
1
2
| data <- iris
data %>% summary
|
1
2
3
4
5
| df <- data
yName <- 'Petal.Length'
ylim <- c(1, 7)
xName <- 'Petal.Width'
subName <- 'Species'
|
1
2
3
4
5
6
7
8
9
10
11
12
13
14
15
16
| options(repr.plot.width=6, repr.plot.height=5)
ggscatter(
data = df[c(xName, yName, subName)] %>% na.omit(),
x = xName,
y = yName,
conf.int = T,
cor.coef = T,
cor.method = 'pearson',
color = subName,
size = 2,
alpha = 0.5
) +
scale_color_manual(values = RColorBrewer::brewer.pal(3, "Dark2")) +
stat_smooth(method = 'lm', se = T, color = 'grey') +
lims(y = ylim) + theme_bw() +
theme(panel.grid = element_blank(), legend.position = "right")
|
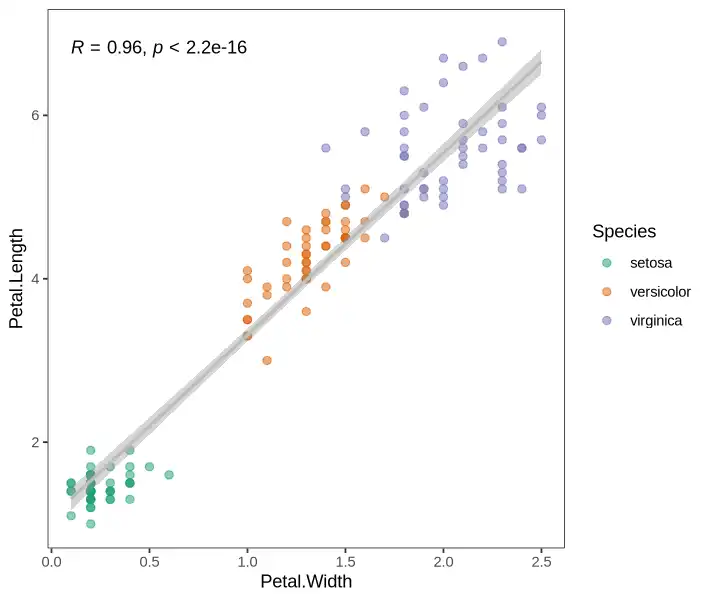
【绘图】相关性散点图
https://hexo.limour.top/scatter-plot-of-correlation